The Issue
Epidemic Rates of Violence
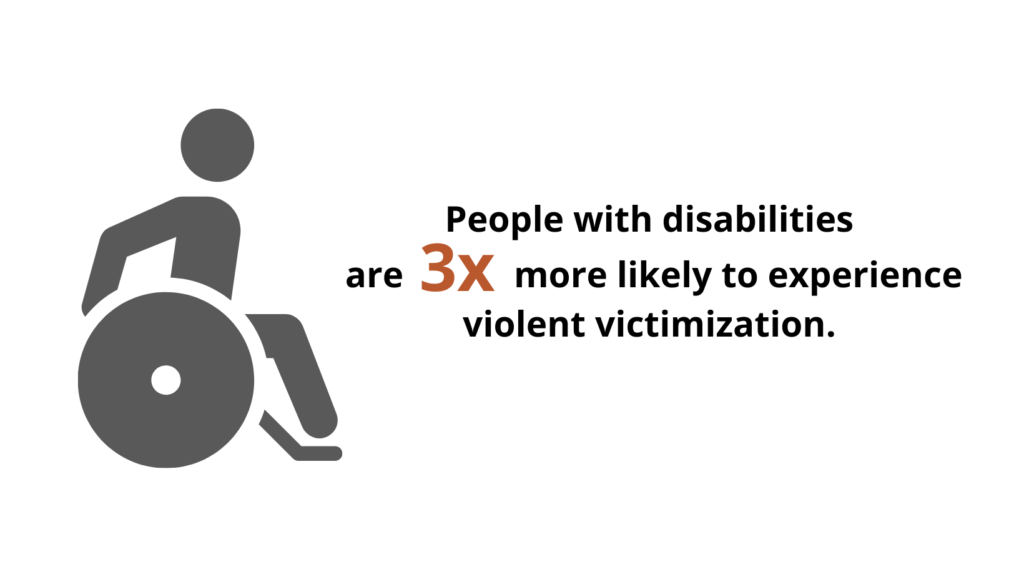
Today, abuse and violence against people with disabilities occurs at rates two to three times the general public, making them one of the most harmed groups in the country.
Rates are even higher for certain groups of people with disabilities: women, people of color, people with intellectual or psychiatric disabilities, and people with multiple disabilities.
A number of factors contribute to people with disabilities being harmed at higher rates including the systemic devaluation of people with disabilities in our society, high rates of isolation, and systems that collude with people who cause harm.
Help Out of Reach
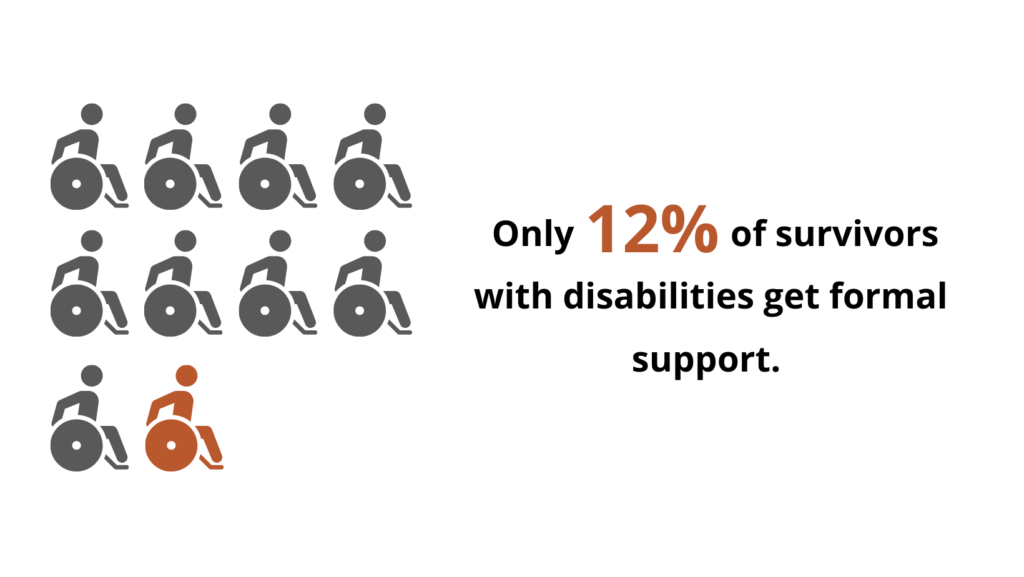
Unfortunately, through no fault of their own, people with disabilities are unlikely to receive services that increase their safety and support their healing.
There are organizations that work with people with disabilities and those that work with survivors. There are other systems that are responsible for things like ensuring public safety or providing medical care. None of these organizations or systems have been designed with survivors with disabilities in mind.
Survivors with disabilities and Deaf survivors face physical, programmatic, communication, and attitudinal barriers. These barriers stand in the way of them getting support.
Efforts to Prevent and Stop Violence Limited
Strategies to prevent abuse of people with disabilities are not widespread, and the consequences faced by those who abuse are minimal, allowing this problem to continue as an unrelenting damaging cycle.
Efforts to prevent violence and abuse are limited. Few focus on the root causes of violence. Without efforts to counter the norms, attitudes, and practices behind the inequities that shape the lives of people with disabilities, abuse continues unchecked.
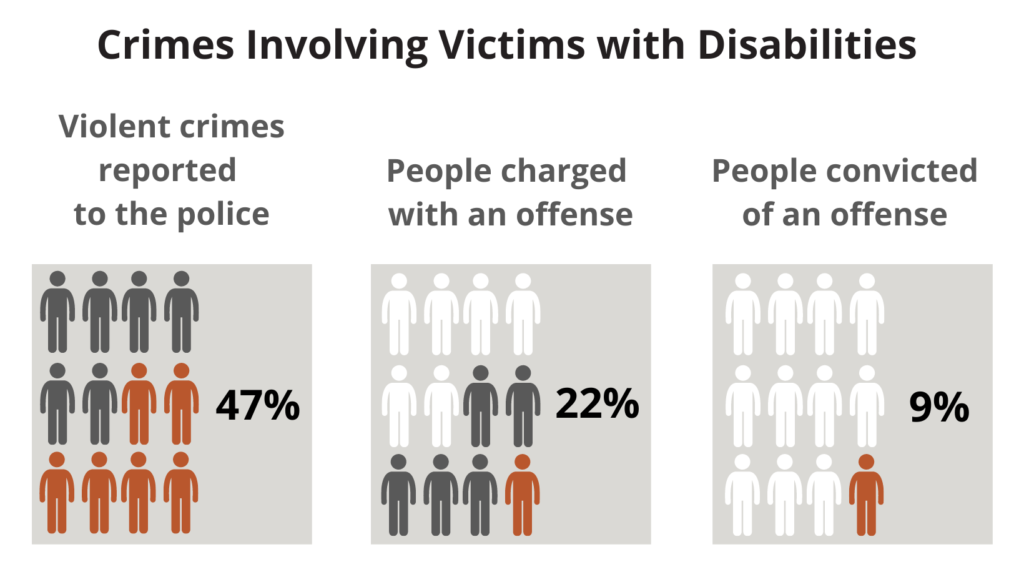
The criminal legal system remains most survivors’ only option for holding the people who harmed them accountable. Many survivors, especially survivors of color, report being retraumatized as they navigate barriers and inequities embedded in this system and the system is ineffective: only 9 percent of cases end in conviction.